Discover how our Analytics tool can help you understand user behaviour and boost your chatbot!
With the advent of new technologies and the evolution of customer expectations, the metrics to track for chatbots have also evolved. That is why we developed our Analytics tool, which will help you monitor the most important indicators in 2023. Thanks to our solution, you can access metrics such as engagement rate, query resolution rate, and customer satisfaction rate, so you can adjust your chatbot strategy accordingly.
Let us look together at the 5 metrics to track!
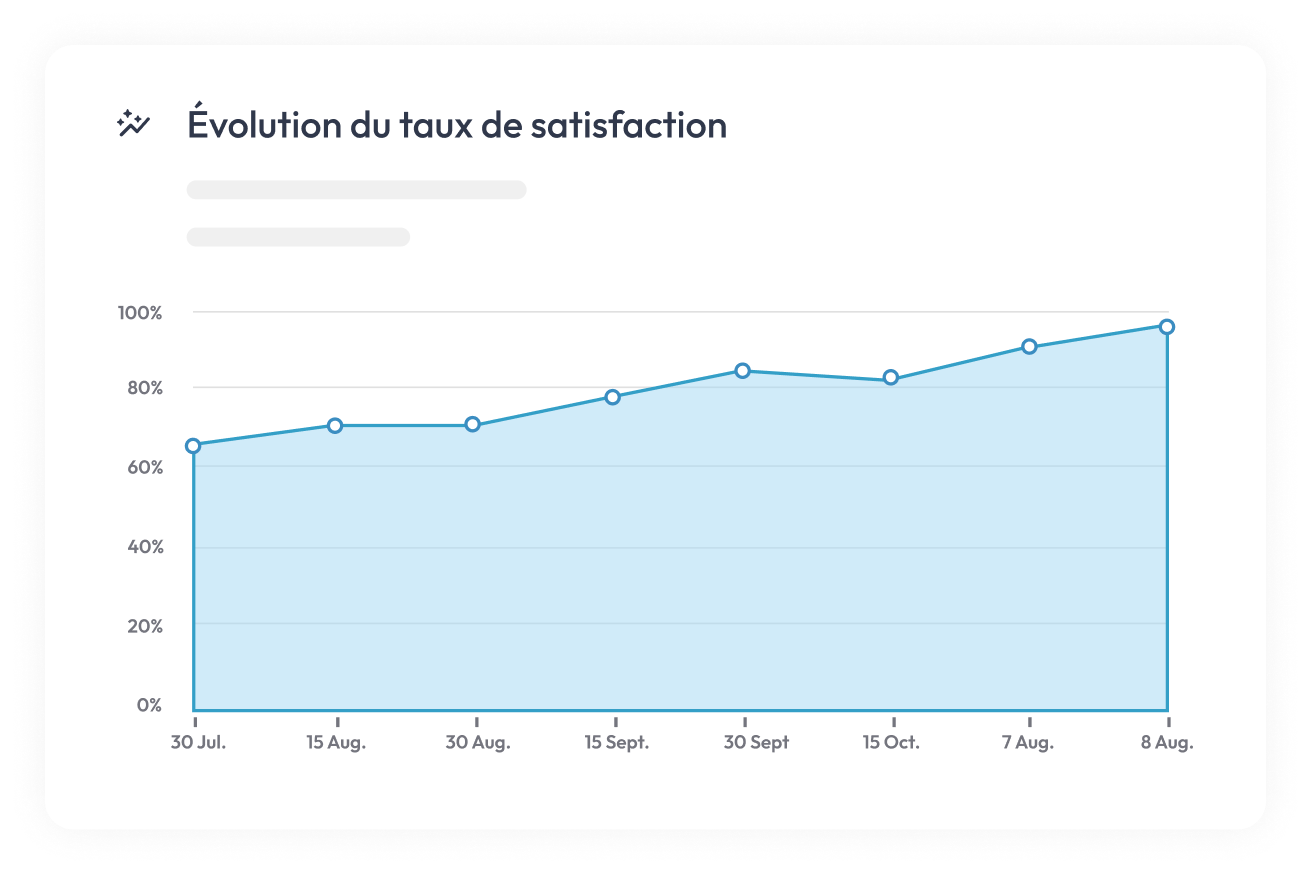
⭐️ Satisfaction Rate with Analytics
This metric lets you understand how your users feel overall. You can see whether customers are satisfied with the answers they receive. By drilling into the satisfaction rate per Q&A, you can identify which Q&As need improvement and adapt responses accordingly.
At tolk.ai we have a distinctive feature: after an unsatisfactory interaction, the end user can indicate the reason for their dissatisfaction. We thus collect both quantitative and qualitative data, enabling more precise bot management 🙌🏼
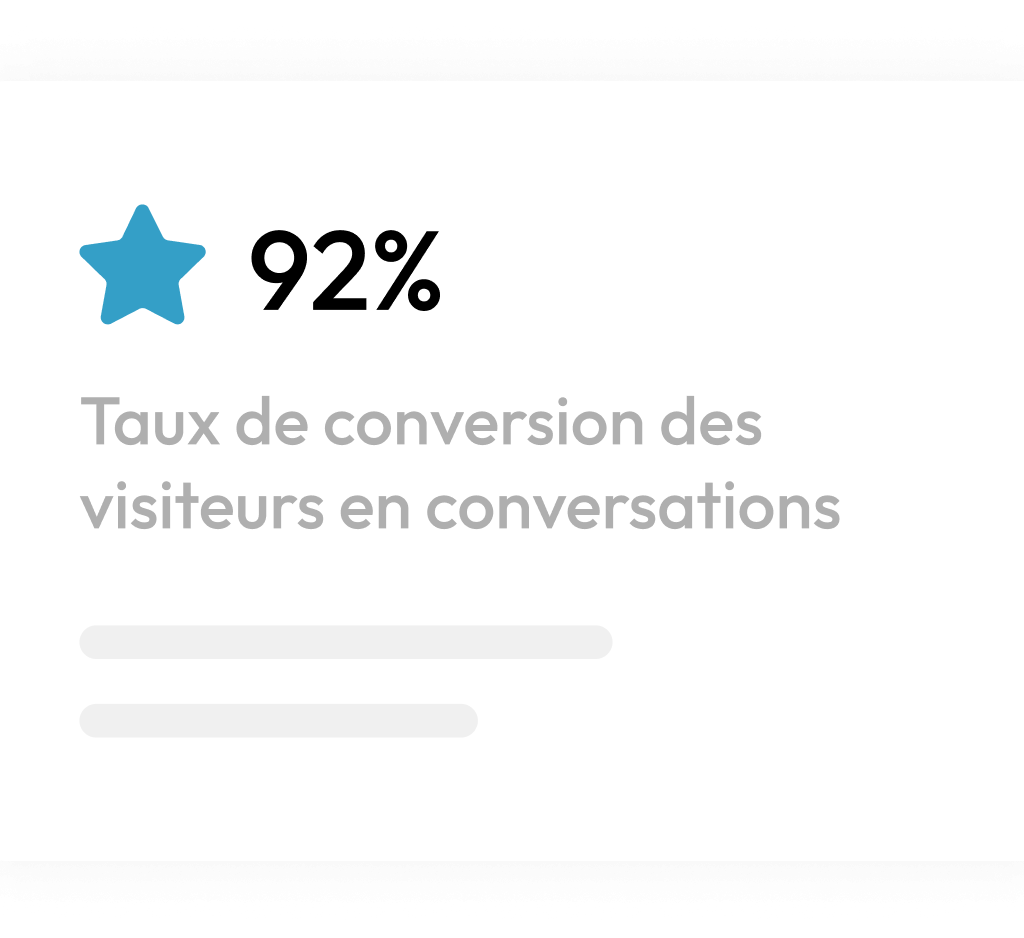
🔗 Conversion Rate
This metric lets you know the percentage of visitors to your site who used the bot. With the detail view, you can track the URLs where the bot is triggered most often. With our new Campaign feature, you can refine the user journey by customising hot topics based on the connection URL, encouraging users to find the information they are looking for more quickly 📍
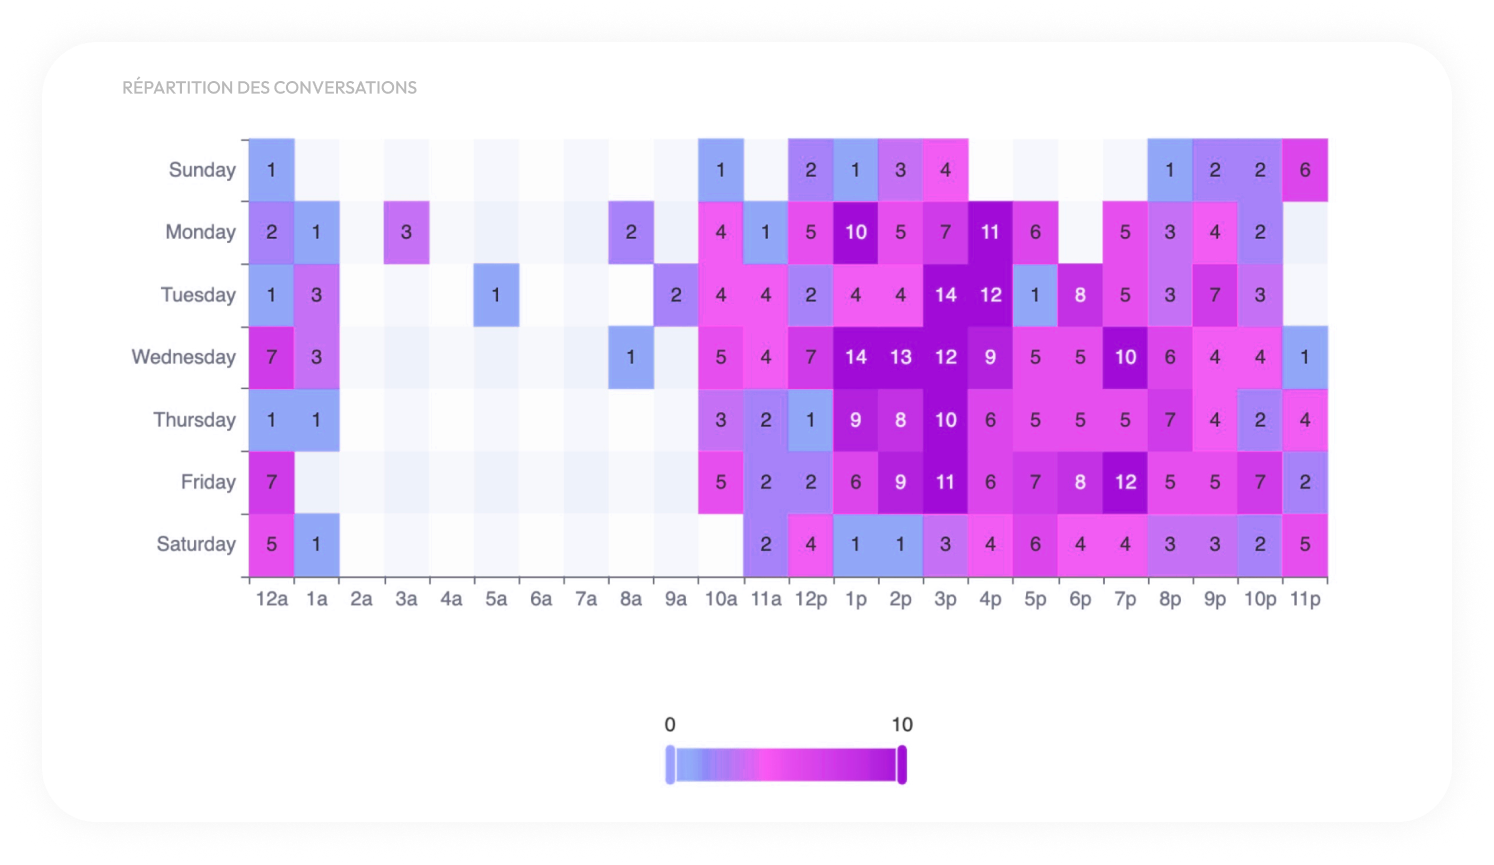
😴 Conversation Distribution
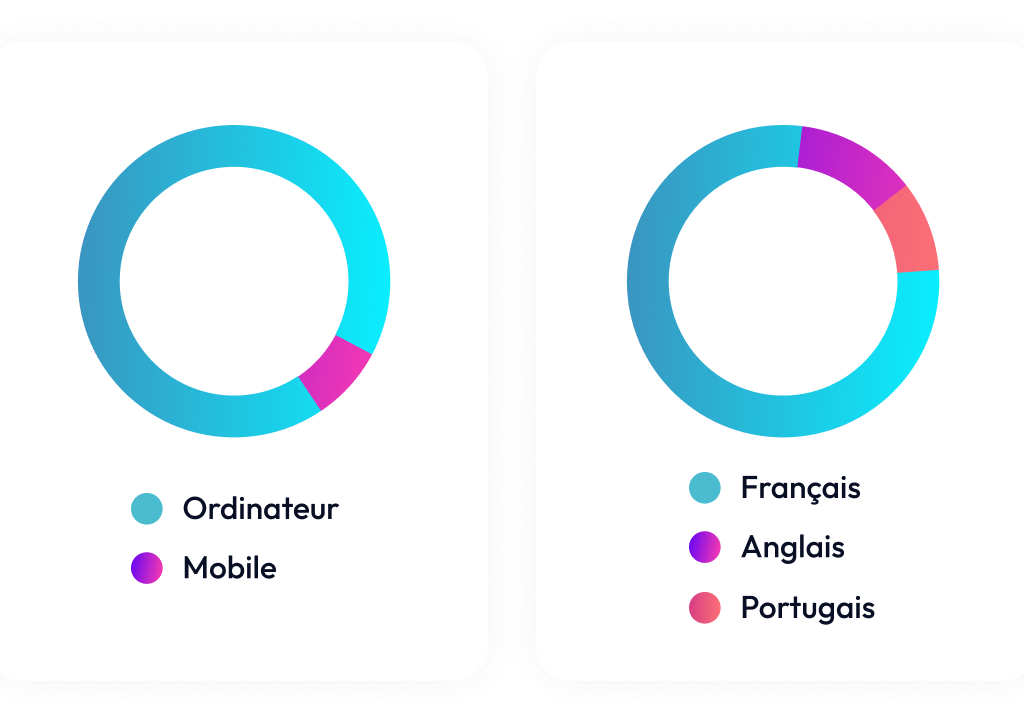
🇺🇸 Audience Analysis (Devices, Browser languages)
These metrics give you insight into user trends across different channels (for example to adapt the formats of your sites and bots) and the default browser languages of your users. This lets you assess whether there is value in adding our multilingual option. To learn more about it, follow this link: the bot tool and its multilingual option 🕺🏻
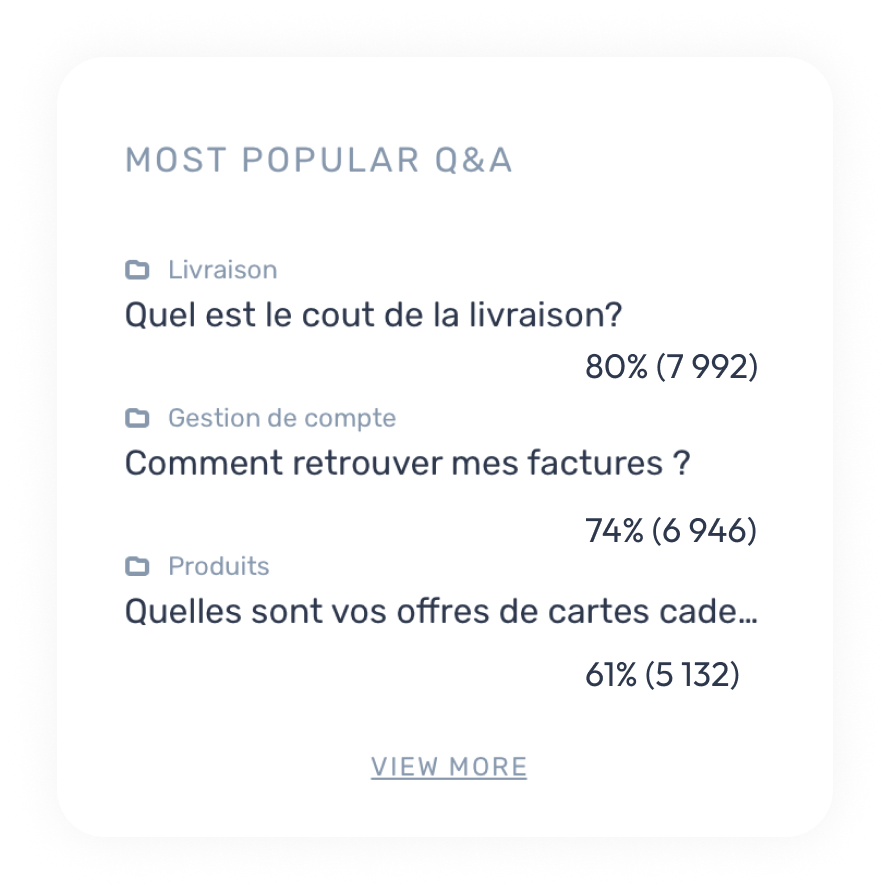
💬 Q&A Overview
This metric includes:
- Most Popular Q&A 💬
- Top Q&A that lead handovers 🤝🏼
- Most Disliked Q&A 👎
- Popular topics 🔥
They allow you to understand Q&A usage and readjust your onboarding (the way your chatbot presents itself to your customers) and hot topics to push the requested information even faster. You can also identify what generates handovers to a human agent and dissatisfaction. At a glance, you have the full list 👀
In conclusion, chatbots are becoming increasingly important for companies looking to improve the customer experience and optimise business processes. However, to maximise their performance, it is crucial to track the right metrics.
With our Analytics tool, you can fine-tune your strategy, adapt your processes for better performance, and deliver an optimal customer experience to your users. By leveraging the insights provided by our tool, you can ensure your chatbots operate at peak performance to meet your business objectives while delivering an exceptional customer experience 🤩
A well-trained chatbot can therefore be a powerful tool for improving your company’s performance and meeting your customers’ needs.
Do not wait any longer, request a demo to unlock the full potential of conversational AI: book a demo 🚀